skip to main | skip to sidebar

Blake Dixon's Map Catalog

Wednesday, August 6, 2008

Infrared Aerial Photo


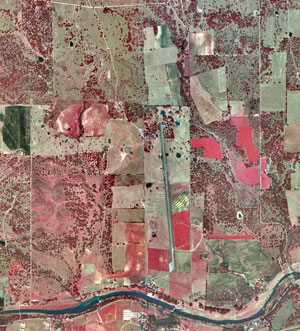
This is an infrared aerial photo of Lyndon B. Johnson National Historical Park. Colors are used to show different areas of the picture. Generally red tones in color infrared aerial photographs are associated with live vegetation and the tone of red can be used to monitor the density and health of the vegetation.
http://www.nps.gov/lyjo/naturescience/naturalfeaturesandecosystems.htm
Posted by Blake Dixon at 4:51 PM

No comments:

Post a Comment

Newer Post Older Post Home
Subscribe to: Post Comments (Atom)

Blog Archive

  • ▼  2008 (51)
    • ▼  August (43)
      • Floor Plan
      • Terminal Area Chart
      • Nautical Chart
      • Tectonic Map
      • Dymaxion Map
      • Pictoral Map
      • Geologic Map
      • Albedo Map
      • Orienteering Map
      • Population Profile
      • Wind Rose
      • Climograph
      • Scatterplot
      • Triangular Plot
      • Parallel Coordinate Plot
      • Stem and Leaf Plot
      • Star Plots
      • Correlation Matrix
      • DOQQ
      • DLG
      • Isopleth Map
      • Isopach Map
      • DRG
      • Isohyet Map
      • Isotach Map
      • Isobar Map
      • Black and White Aerial Photo
      • Choropleth Map
      • Similarity Matrix
      • Box Plots
      • DEM
      • Histogram
      • Lorenz Curve
      • Dot Distribution Map
      • Propaganda Map
      • Infrared Aerial Photo
      • Doppler Radar
      • Flow Map
      • Isoline Map
      • Proportional Circle Map
      • Hypsometric Map
      • PLSS Map
      • Mental Map
    • ►  June (5)
    • ►  May (3)

About Me

Blake Dixon
View my complete profile