Wednesday, August 6, 2008

Propaganda Map


This propaganda map claims that China discovered the Americas before Christopher Columbus. The use of Chinese markings makes claims that Zheng He sailed around he world around 1418, finding the Americas along the way.
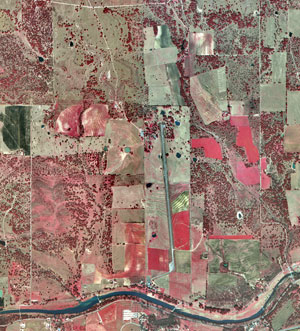


Infrared Aerial Photo


This is an infrared aerial photo of Lyndon B. Johnson National Historical Park. Colors are used to show different areas of the picture. Generally red tones in color infrared aerial photographs are associated with live vegetation and the tone of red can be used to monitor the density and health of the vegetation.

Doppler Radar


This doppler radar image is of hurricane Claudette in 1993. The radar picks up the radial velocity of the storm and shows an in depth picture of rainfall and directional motion of the storm within the radar's reach.

Flow Map


This flow map uses color, shading, and directional lines to show the flow of air traffic at King County International Airport in relation to their Fly Quiet program. The directional lines show where an airplane will fly over noise sensitive areas so that the pilot will know where he/she would need to follow the Fly Quiet regulations.

Isoline Map


This is an isoline map that uses continuous lines to join points of the same value. This map uses isotherm lines and color/shading to show high temperatures across North Carolina on January 31, 1981.

Proportional Circle Map

This is a proportional circle map that shows American Indian Population in various states based on Census Bureau data. You can see from the legend how each circle represents a population number. As the circles size increases, so does the population.

http://cache.search.yahoo.net/search/cache?ei=UTF-8&p=proportional+circle+map&fr=yfp-t-501&u=www.neiu.edu/%7Enerobert/Cartography.htm&w=proportional+circle+circles+map+maps&d=YttYDRg5RKVu&icp=1&.intl=us

Hypsometric Map


This is a map of France with hypsometric tinting. Different colors are used to show elevation changes so that the reader can see the area's relief.